Meet DwellSignal: four free tools to size up a rental market
An introduction to exploring markets, comparing places, and understanding the assumptions behind a property analysis.
A real estate estimate is only worth as much as what went into it.
Which properties are being compared? How old is the underlying data? Is that rental income observed or modeled? What happens if the expenses are higher than expected? And for a short-term rental, what do the local rules actually say?
Those questions are the starting point for DwellSignal, a real estate research product built around them.
It brings together US short-term rental market research, housing data, relocation comparisons, and property analysis. You can explore the core tools for free, without creating an account.
The idea is simple: make it easier to understand a place, examine a property, and see what still needs checking.
Why we built it
We build from one engineering principle: an output becomes more useful when you can understand its inputs and assumptions.
Real estate research makes that especially important. A citywide average can hide differences between neighborhoods. An appealing revenue estimate can depend on an optimistic occupancy assumption. A nearby rental listing can tell you something about the market without establishing that a different property is eligible to operate.
Even getting the context together takes work. Housing prices, rents, comparable listings, local rules, and financing assumptions answer different parts of the same question.
DwellSignal brings more of that context into one research workflow. The standard we work toward is straightforward: show the source, explain the estimate, and make the gaps visible.
What you can explore today
There are four ways into the product, depending on the decision you're considering.
Market Atlas: understand a short-term rental market. Explore places and nearby listings, then look at revenue estimates, rates, occupancy, and seasonality. Where permit information is available, examine that evidence alongside the market data. These are research inputs; modeled revenue and occupancy should be read as estimates.
Housing Explorer: put a place in context. Move from a national view down to a county or ZIP code to explore home values, rents, and housing trends. It's a useful starting point when you want to understand how an area compares with the places around it.
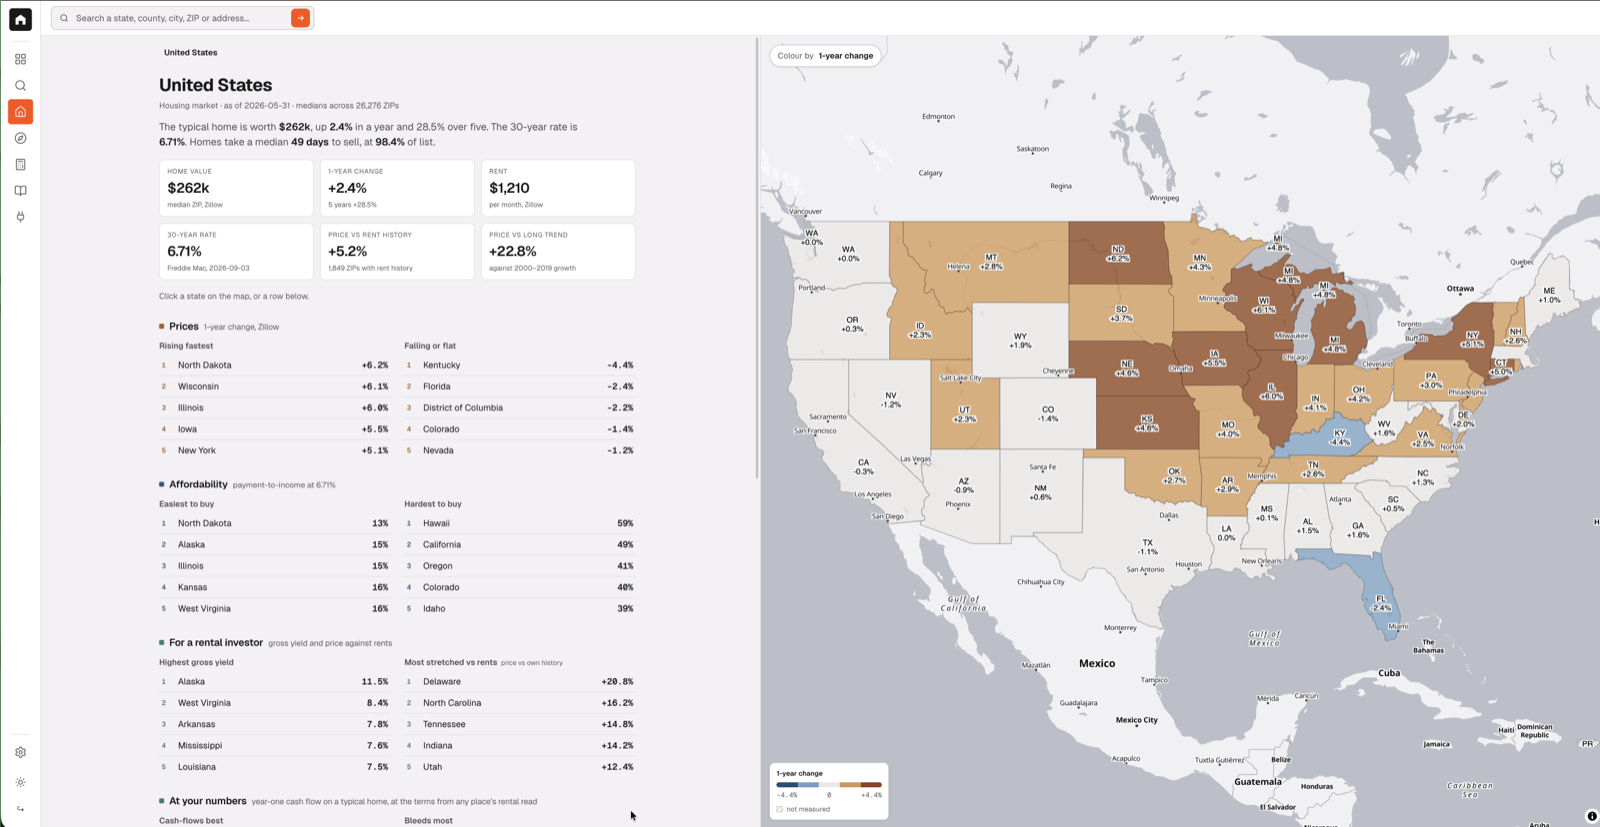
Housing Explorer, captured September 7, 2026. Each metric has its own data vintage; the screenshot date is not the date of every underlying observation.
Move: compare places around your circumstances. Enter an occupation or fixed income, household details, and housing preferences to compare estimated money left each month across areas. The purpose is to make the tradeoffs easier to examine: a higher salary and a lower housing cost can point you toward very different places.
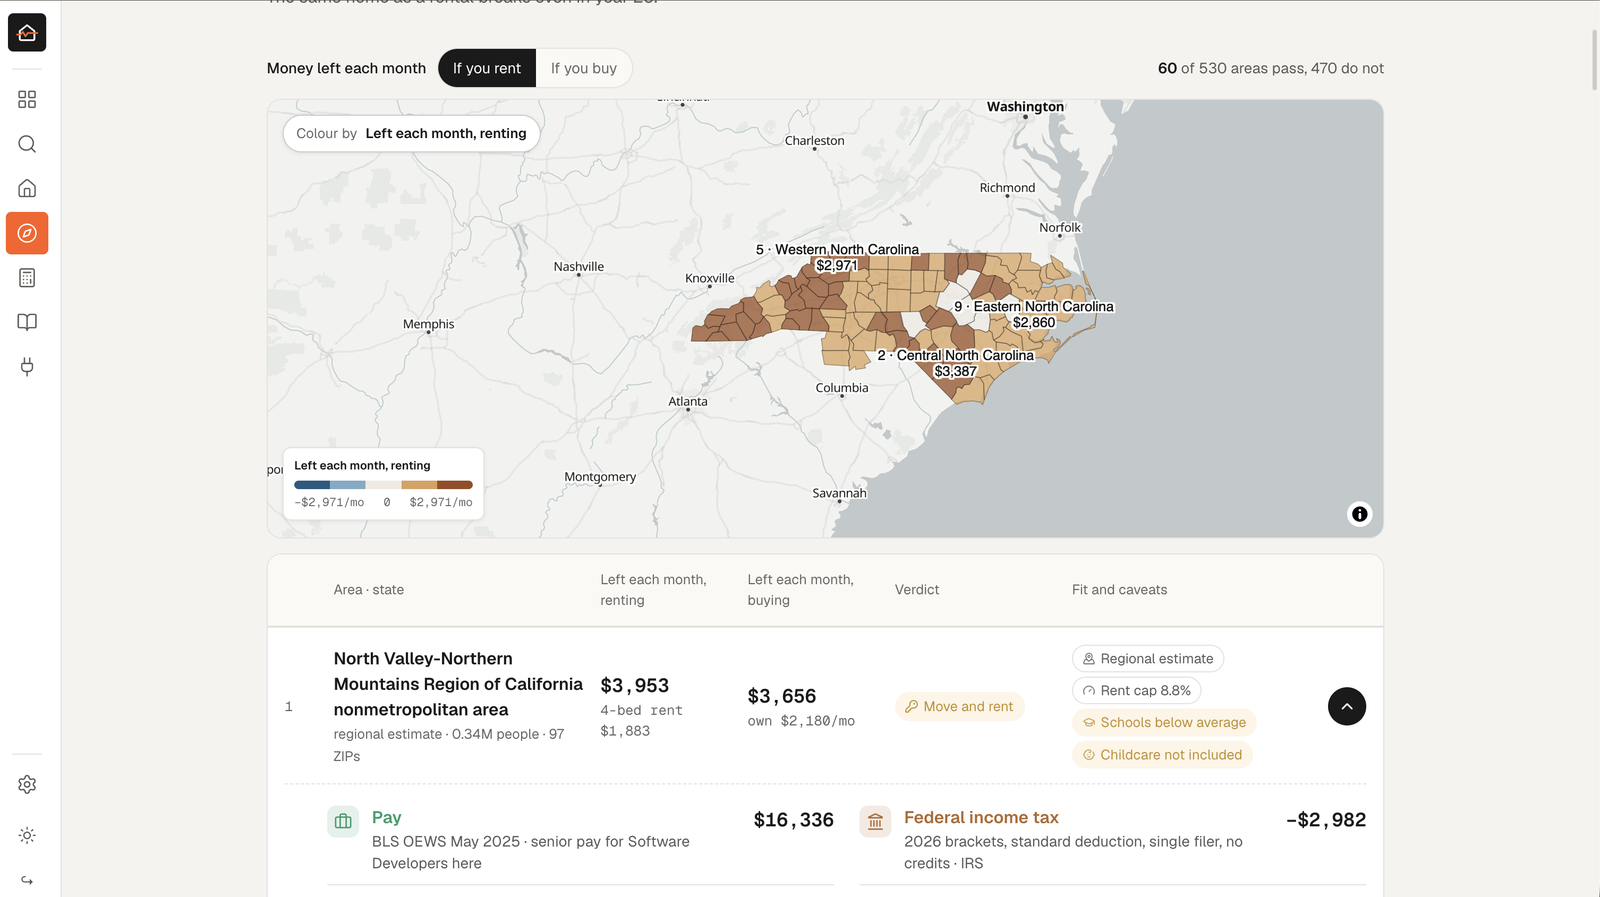
Move, captured September 9, 2026. Each row opens to show the assumptions behind it — pay from BLS OEWS, 2026 federal brackets, local housing costs — and the caveats that apply, such as a regional estimate or childcare not being included.
Deal Desk: test the assumptions behind a property. Start with an address and price, adjust the inputs, and explore downside, base, and upside scenarios. Signed-in users can save and reopen deal analyses, so they can return to the assumptions they were working with.
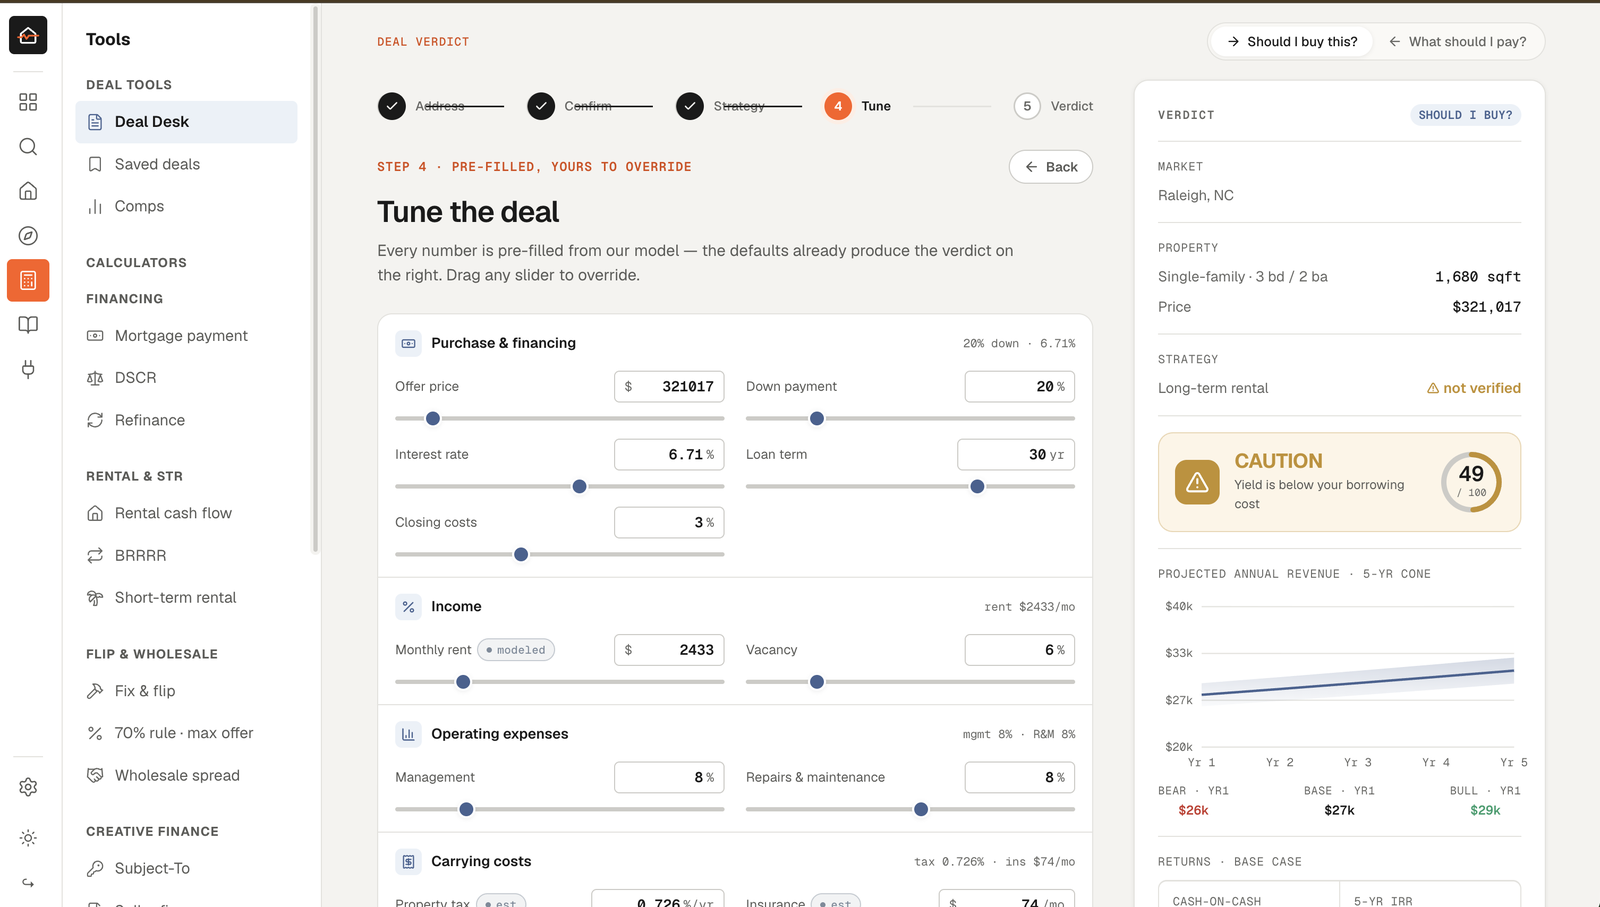
Deal Desk, captured September 9, 2026. Every input arrives pre-filled from the model and can be overridden; the verdict and projection update as you change them. Modeled inputs are labelled, and the verdict says which assumptions it is unsure about.
You don't need to use all four. Start with the question you already have.
Start with somewhere you know
If you try DwellSignal, look up a place you know well before looking for somewhere new.
Open Housing Explorer. Find your area. Look at the local context and compare it with a neighboring ZIP code. Read the source notes as well as the headline figures.
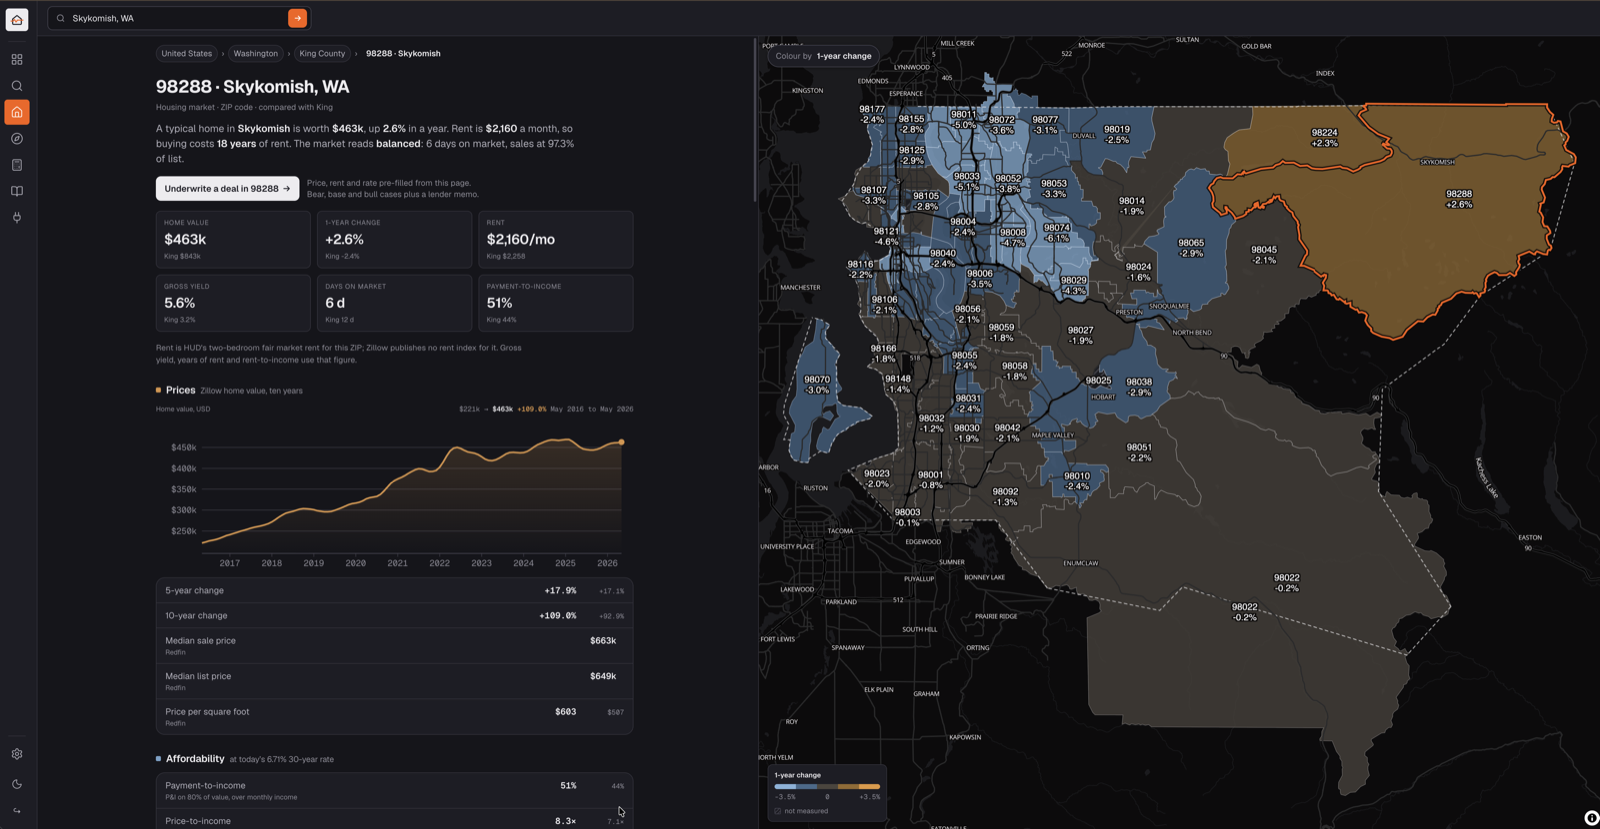
A closer look at a ZIP code in Housing Explorer. This September 7, 2026 screenshot includes a note explaining the rent source used for this area.
Then, if you have a property in mind, take the research into Deal Desk and change an assumption. Try a different purchase price or financing input. See how much of the result depends on the number you changed.
That is what DwellSignal is built to make easier: understanding why a result looks the way it does, and knowing what information would help you evaluate it further.
The uncertainty belongs in the product
Data coverage varies. Some figures come from published datasets; others are modeled estimates. Sources update on different schedules, and some questions require information that an area-level dataset cannot provide.
Permit evidence also needs careful interpretation. A registry match is useful evidence to investigate. An unmatched listing does not, by itself, establish illegality. Eligibility for a particular property still needs verification with the relevant jurisdiction.
DwellSignal is early, and we are still improving the data and the experience. Making those limits understandable is part of the work.
What we are working on next
Alongside the free tools, we are opening a professional pilot for short-term rental managers, co-hosts, and agents who repeatedly evaluate properties for owners or clients.
The proposed deliverable is a property qualification packet: relevant permit and jurisdiction evidence, revenue estimates, comparable listings, operating assumptions, and unresolved questions. That pilot is separate from the free exploration tools.
For now, try the product on a place you actually know.
Explore DwellSignal free. No account is needed to browse.
Then tell us: what did you still have to look up somewhere else?
Email hello@dwellsignal.com. That missing piece is useful feedback for deciding what to build next.